EL NIÑO IS BACK. SEE WHAT IT MEANS FOR SNOWPACK AND WATER FROM THE ROCKIES TO THE RIO GRANDE.
ALBUQUERQUE, N.M., Oct. 7, 2026
Press Release Disclaimer: This is a press release distributed through the XPR Media network. It has not been independently verified by our newsroom.

EL NIÑO IS BACK. SEE WHAT IT MEANS FOR SNOWPACK AND WATER FROM THE ROCKIES TO THE RIO GRANDE.
PR Newswire
ALBUQUERQUE, N.M., Oct. 7, 2026
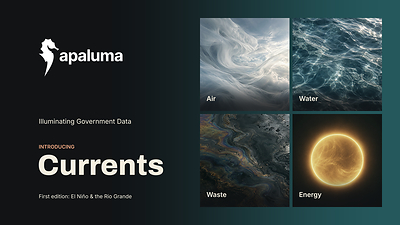
Apaluma launches Currents, a public series of interactive models built on open federal data. Mapped with Esri ArcGIS, the first release details conditions and provides snowpack forecasts across the Rio Grande corridor
ALBUQUERQUE, N.M., Oct. 7, 2026 /PRNewswire/ — Apaluma, which transforms fragmented regulatory records into a unified ecosystem, today launched Currents, a series of interactive online models built on open federal datasets and powered by Esri ArcGIS mapping technology.
The first release, El Niño & the Rio Grande, lets users follow changing weather patterns in the Pacific Ocean and what they mean for snowfall and river levels on the mainland. The model is live at currents.apaluma.com.
“Ocean temperatures, forecasts, river and snowpack levels, and other public data behind El Niño are scattered across a dozen federal sources,” said Alicia J. Keyes, founder and CEO of Apaluma. “Currents unifies that data so that people can make sense of it.”
Apaluma’s launch follows the National Oceanic and Atmospheric Administration’s Climate Prediction Center El Niño advisory issued in September. Forecasters give the event a greater than 90 percent chance of persisting through the winter, with Pacific temperatures projected to rank among the strongest El Niño events on record — a pattern that historically means a wetter, snowier winter across the Southwest. Apaluma’s El Niño & the Rio Grande model aggregates a dozen public data sources into a single dashboard: live sea-surface temperatures, daily forecast spread, snowpack projections, and river levels for the corridor from the San Luis Valley to Albuquerque.
The model currently shows central Pacific temperatures running more than 2.5°C above normal and projects peak corridor snowpack of 20.2 inches of snow-water equivalent, about nine percent above the long-term median. It also discloses the integrity of its visualizations in real time: a verification panel tracks whether the ocean and atmosphere are coupled, and the model states plainly that a regional climate signal cannot attribute any single day’s rain or snow to El Niño.
“El Niño weather conditions are well-known by the public but not particularly well understood,” Keyes said. “With this new series, our goal is to make connected public data useful.”
About Apaluma
Government agencies hold the data that shapes daily life: Permits, regulations, and environmental records are all public records. Most of it sits in PDFs, scanned ledgers, and incompatible databases. It exists, but no one can use it. Apaluma transforms these fragmented regulatory records into one connected ecosystem. The records become searchable, secure, mapped to real-world locations, and governed by each agency’s own rules. The platform is purpose-built for the full regulatory life cycle and serves analysts, scientists, and regulators who need answers in hours, not weeks. Apaluma also publishes Currents, a public series of interactive models built on open federal data, at currents.apaluma.com.
For more information, visit www.apaluma.com.
FAQ
What is Apaluma Currents?
Currents is a public series of interactive models from Apaluma that connect open federal data — ocean temperatures, forecasts, river gauges, and snowpack sensors — into a single, on-demand dashboard. The first release covers El Niño and snow and water levels in the Rio Grande corridor.
What is ArcGIS?
ArcGIS is a comprehensive geospatial platform for professionals and organizations. It is the leading geographic information system (GIS) technology. Built by Esri, ArcGIS integrates and connects data through the context of geography. It provides world-leading capabilities for creating, managing, analyzing, mapping, and sharing all types of data. Organizations that use ArcGIS to understand and analyze their data in geographic context have a distinct advantage and decision-making edge.
What does the Apaluma El Niño model show?
Live Pacific sea-surface temperatures against the historical record, NOAA’s official El Niño probabilities, daily precipitation forecasts for seven corridor locations compared with each location’s own 30-year normal, and a projected snowpack curve for the upcoming winter.
Does it cost anything to use?
No. Currents is public, requires no login, and is built entirely on open data from NOAA, USGS, NRCS, and other federal sources, with every figure cited to its source.
Will El Niño mean a big snow year in New Mexico and Colorado?
The odds favor it, but the model is careful about what that means: El Niño tilts probabilities toward a wetter winter and larger snowpack in the southern tier without guaranteeing any outcome, and no single storm or dry spell can be attributed to it. Currents shows the forecast spread and the uncertainty alongside the headline numbers.
Where does the El Niño model get its data?
Live and published feeds from the NOAA Climate Prediction Center, Open-Meteo and NOAA forecast ensembles, USGS Rio Grande stream gauges, and NRCS SNOTEL snowpack stations, mapped with Esri ArcGIS technology.
Can I use Apaluma Currents in a story, classroom, or report?
Yes. Currents is built to be shared and cited, with attribution to Apaluma and the underlying federal data sources.
For more information:
matthewmurray@cozen.com

 View original content to download multimedia:https://www.prnewswire.com/news-releases/el-nino-is-back-see-what-it-means-for-snowpack-and-water-from-the-rockies-to-the-rio-grande-302901199.html
SOURCE Apaluma